
Most marketers are focused on conversion and conversion rates. While this is an important KPI an evenly important one is the revenue per visitor (RPV) indicator. The RPV is about creating an e-Commerce experience that maximises the sales each time someone shops on your website.
I have chosen to base this post on a report made by Qubit, “What works in e-commerce – a meta-analysis of 6700 online experiments”. The authors of the report analyzed a number of e-Commerce operations in retail and travel. Since this report is commissioned by a company, some parts of it should be taken with a grain of salt. However this is still a relevant report, since finding a large enough sample is quite difficult in the area of e-Commerce and website improvement. I have chosen some of the highlights from the report and mixed it with my own insight, you should read the full report by Qubit here.
SCARCITY AND STOCK INDICATORS (2.9%)
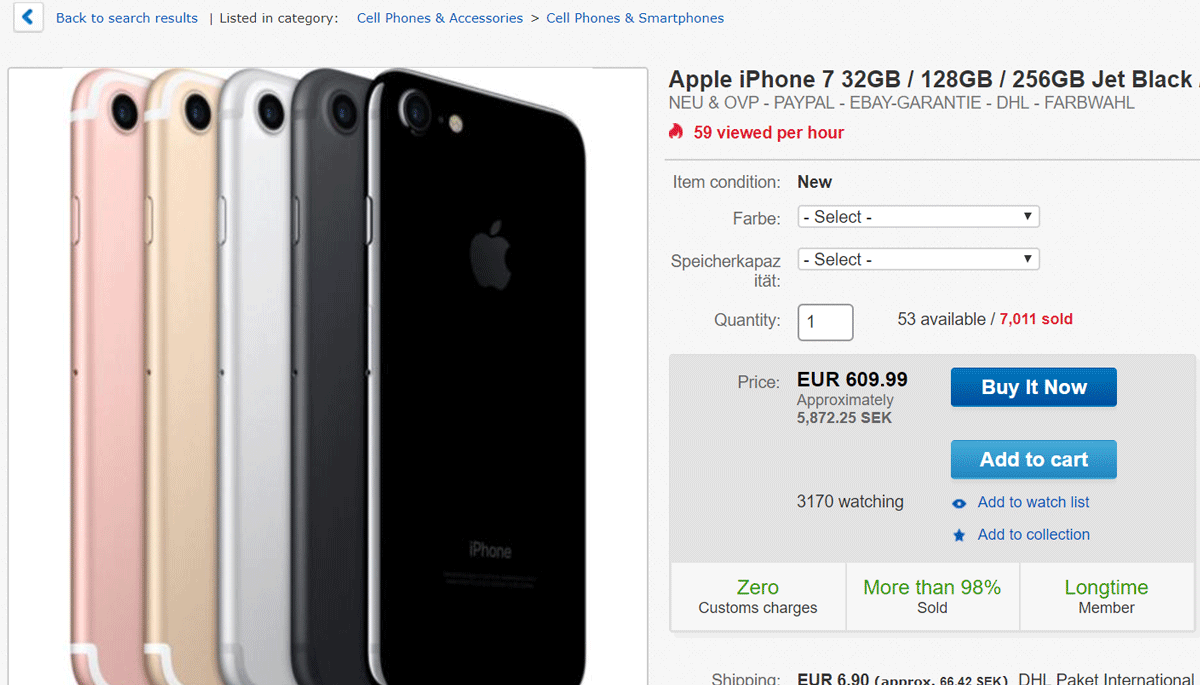
Providing a stock indicator, or indicating that a product or service is limited or low in stock has according to the report 2.9% uplift in revenue per visitor. This is above all the most important factor when it comes to influencing the RPV.
Ebay is pretty good at displaying stock and at the same time communicating scarcity. For example they enable sellers to display their exact amount of items in stock and how many that have been sold (which connects well with social proof, next item on the list).
SOCIAL PROOF – OTHERS HAVE BOUGHT (2.3%)
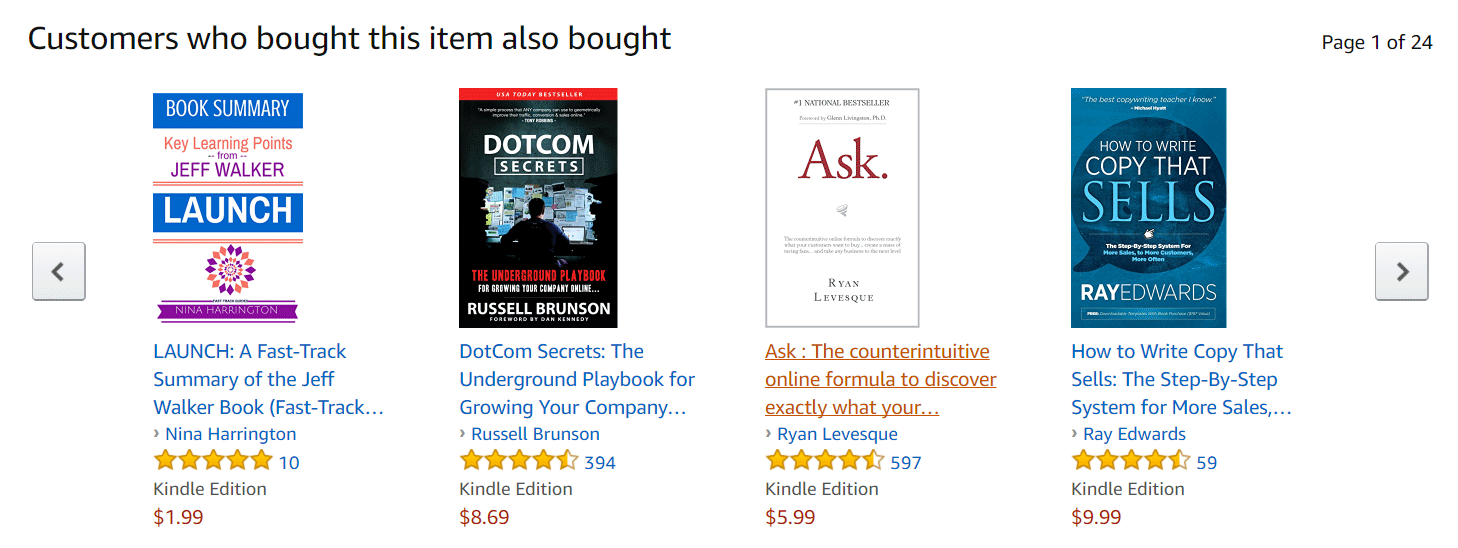
Social proof within e-Commerce is based on other users behaviour displaying trending items, popular products and best-sellers. An interesting example is the “Others have bought” functionality on Amazon, but can also be a light-weight top-list of bestsellers.
URGENCY (1.5%)
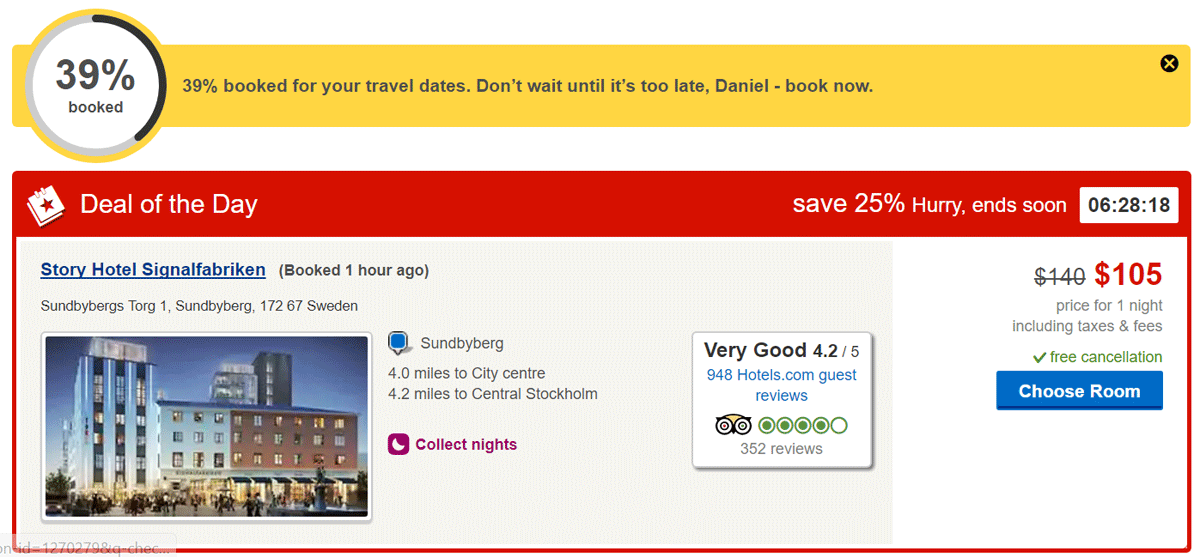
Providing urgency to prospective buyers proved to provide 1.5% uplift in revenue per visitor. Examples of this can be a countdown timer, or limited time available. A website that does this very successfully is Hotels.com, using the urgency and scarcity variables throughout.
ABANDONMENT (1.1%)
Trying to close the deal when a user starts displaying abandonment behaviour, such as abandoning cart or leaving the page. The most common example is abandon cart e-mails, which most e-tailers are using.
An effective strategy can be to feature discounts, promotions or recommendations in the abandon e-mail to trying to seal the deal. If you are selling more complex products try offering a consultation in the e-mail, guiding the customer in the right direction.
PRODUCT RECOMMENDATIONS (0.4%)
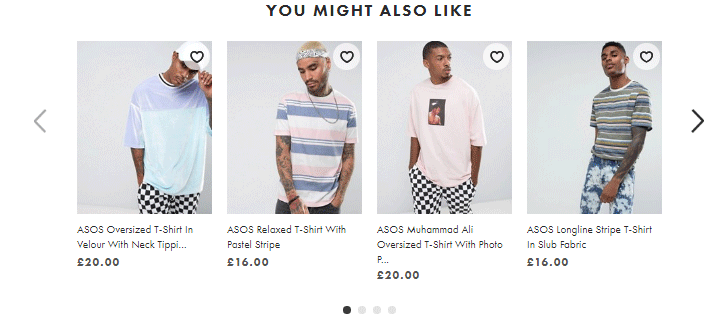
This is basically providing recommendations of products to visitors. There are multiple ways of doing this, it can for example be mixed with social recommendations. Below is an example of on product page recommendations from ASOS.
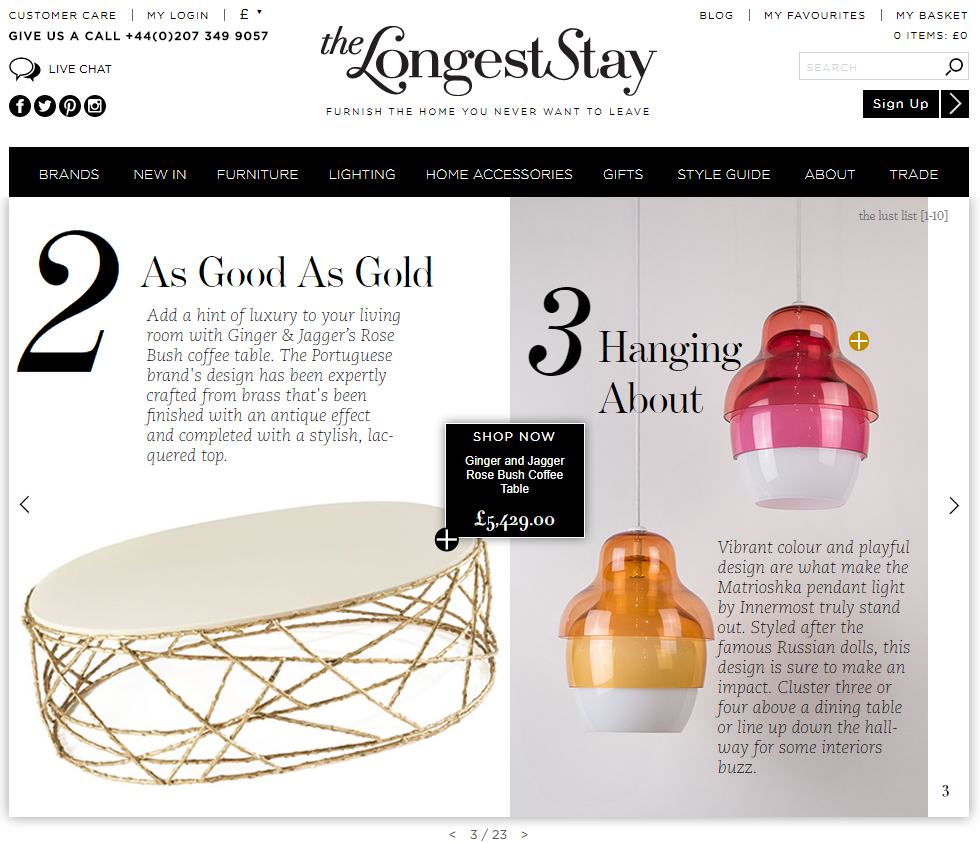
Another way of providing product recommendations to your audience is to create articles and magazine content, linking to the buying experience. This is a powerful way of establishing thought leadership within a specific product category. A good example is the designer furniture retailer The Longest Stay:
WELCOME MESSAGE (0.2%)
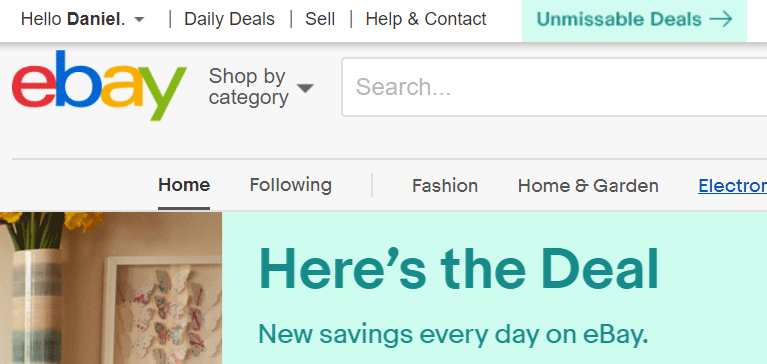
Demonstrating that you know the customer’s name have some effect on the RPV. In my opinion this is best done with a personalisation. One simple example is just providing a name when the user logs in, e.g “Hi Daniel”.
PAGE REDESIGN (0.2%)
This is rather interesting, according to the report a page redesign where moving the elements around on the pages significantly only constitutes to an uptick of 0.2% of revenue per visitor. The way to interpret the report is probably to start with the basics above before commencing on a total page redesign.
On the other hand if your website is converting badly a redesign can increase the conversions, not necessarily the RPV.
NUDGES, POP-UPs, COLORS (0.0%)
Rather interestingly the authors of the Qubit report didn’t conclude that minor design changes, such as changing colors to a button, adding a nudge or pop-up have any significance on the revenue per visitor.
This goes against much of the best practices in the industry. Where often A/B-testing is part of improving e-Commerce conversion rates but apparently it does not influence revenue per visitor.
FEATURES WITH NO IMPACT ON REVENUE PER VISITOR
In the report Qubit says that Mobile navigation have no impact on the RPV. This was quite surprising for me, my initial thought was that you would enable more visitors to buy, thus the revenue per visitor would be increase. However this might not be the case as revenue per visitor and conversion rate is not necessarily linked (the authors point this out in the report). Mobile navigation will increase conversion rates, but it doesn’t necessarily impact the revenue per visitor.